In 2019 David Borden Buckley was invited to create a temporary installation for the Penn State Abington campus. His previous work, such as Hemlock Hospice and Warming Warning, involve landscape architecture and design in works of art that express his ecological research. His piece for Penn State, Data Decision Trees, aims to do the same with the focus on the growing issue of climate change.
Buckley created his design for the installation based on his research on climate change and finding a way to express the data through art and design. The aim was for this piece was to be accessible to everyone, in that anyone who views it can understand the information it presents. He also sought to inspire environmental stewardship in the audience. The design of the piece presents various graphical data sets in the form of fallen trees, the trunk and branches mimicking the graphs they represent. Originally there was only one fallen tree, but Buckley decided on including numerous trees in order to provide more information.
Before the building process could begin, further research was necessary. There are 12 different trees representing 12 different data sets based around climate change and ecology. The students assisting Buckley with the project provided this data; each student found graphs based on their personal interests or concerns in climate change and other environmental issues. For example, one tree will represent a graph showing average global temperature rise while another shows the growth of plastic waste pollution.
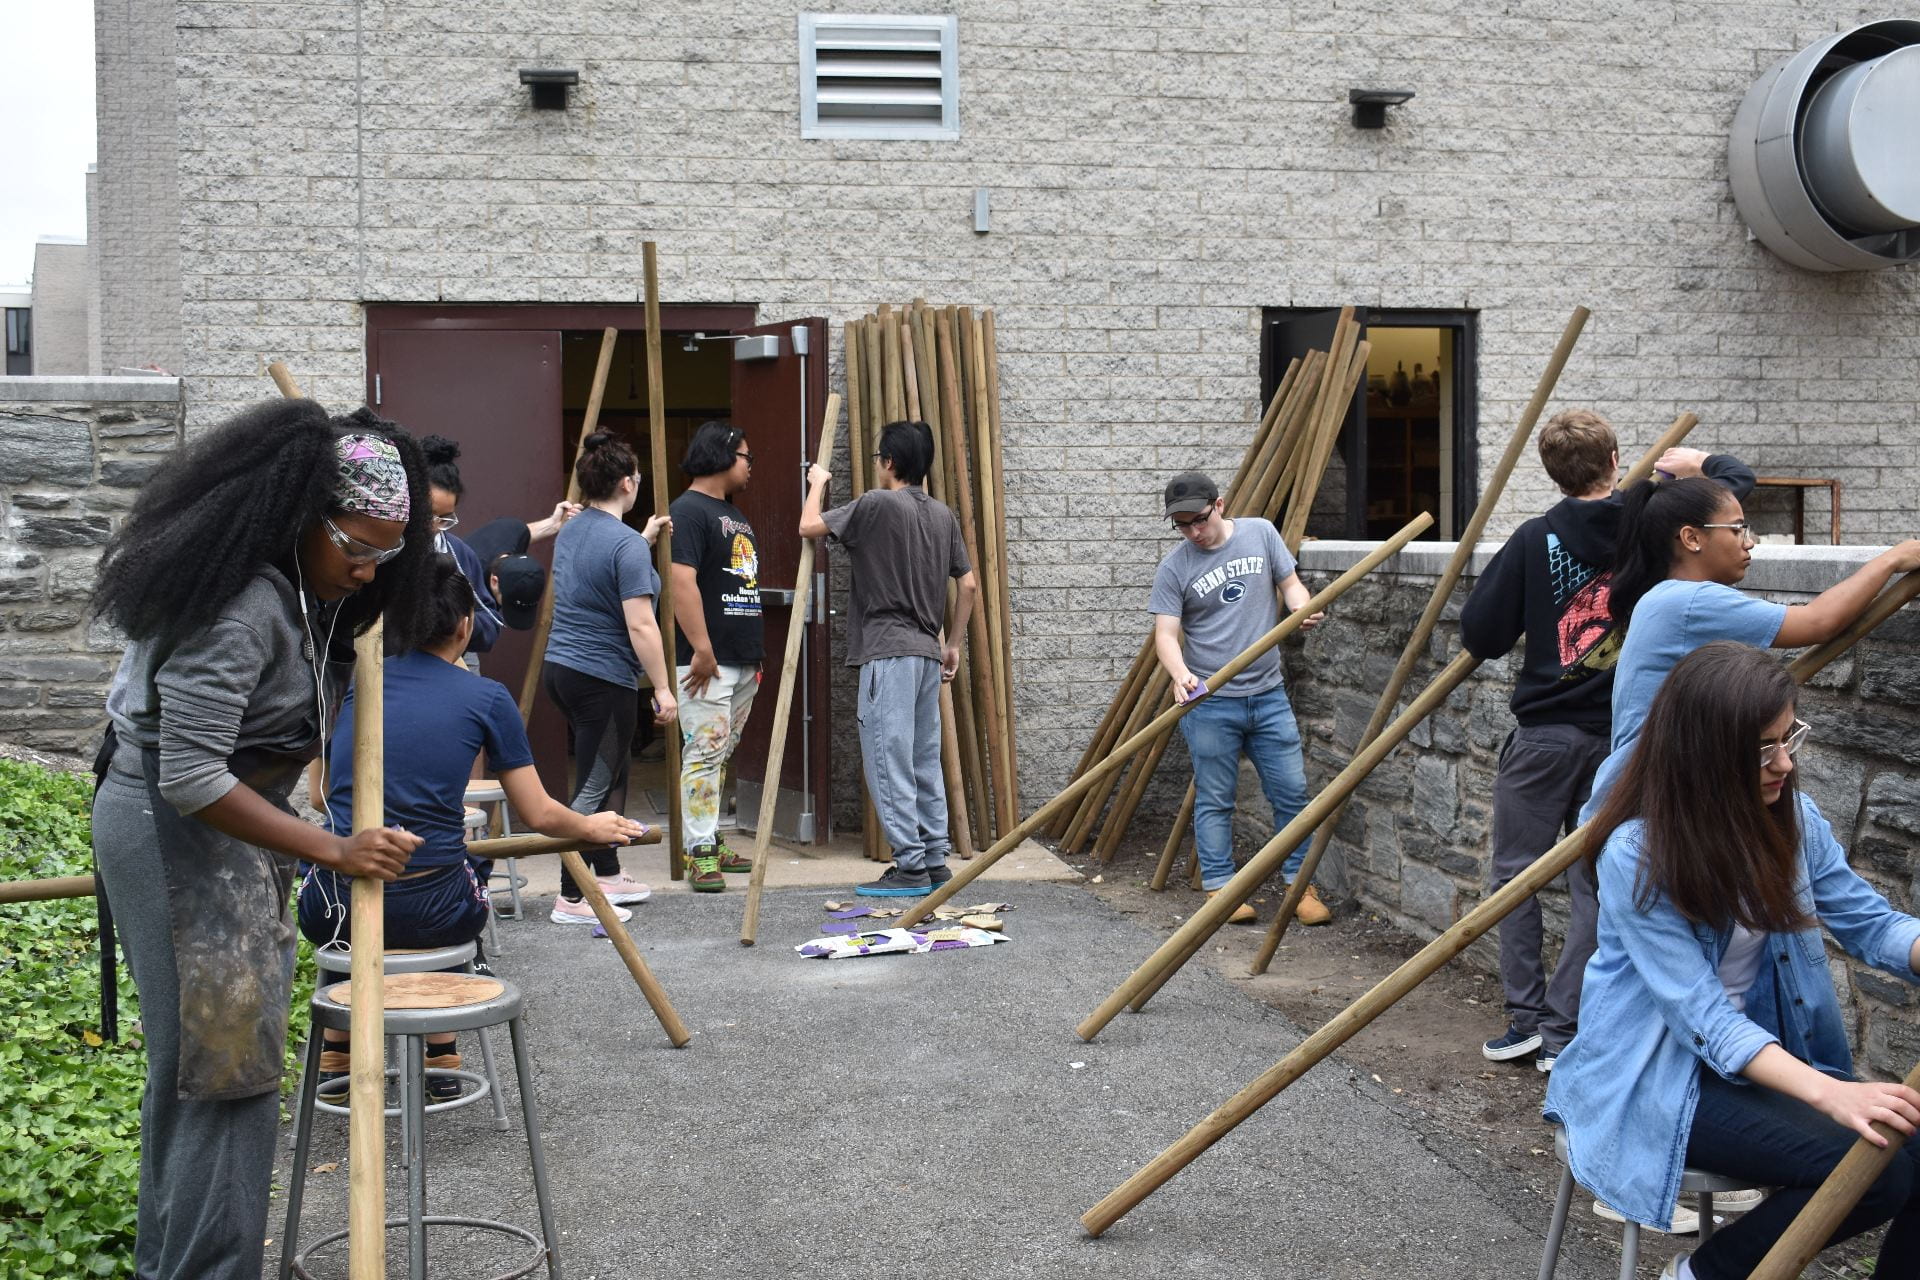
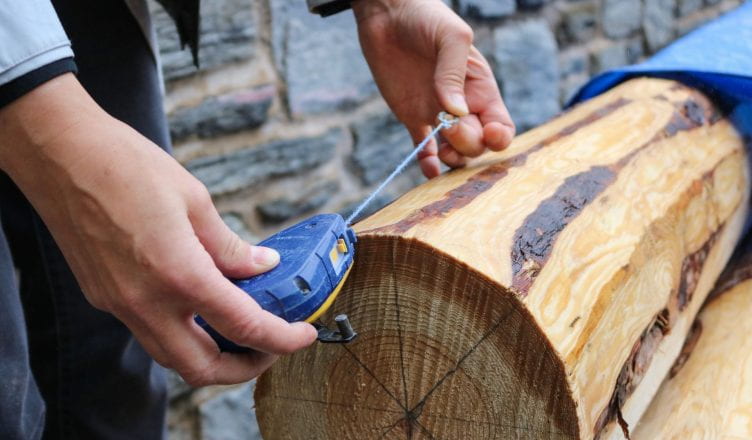
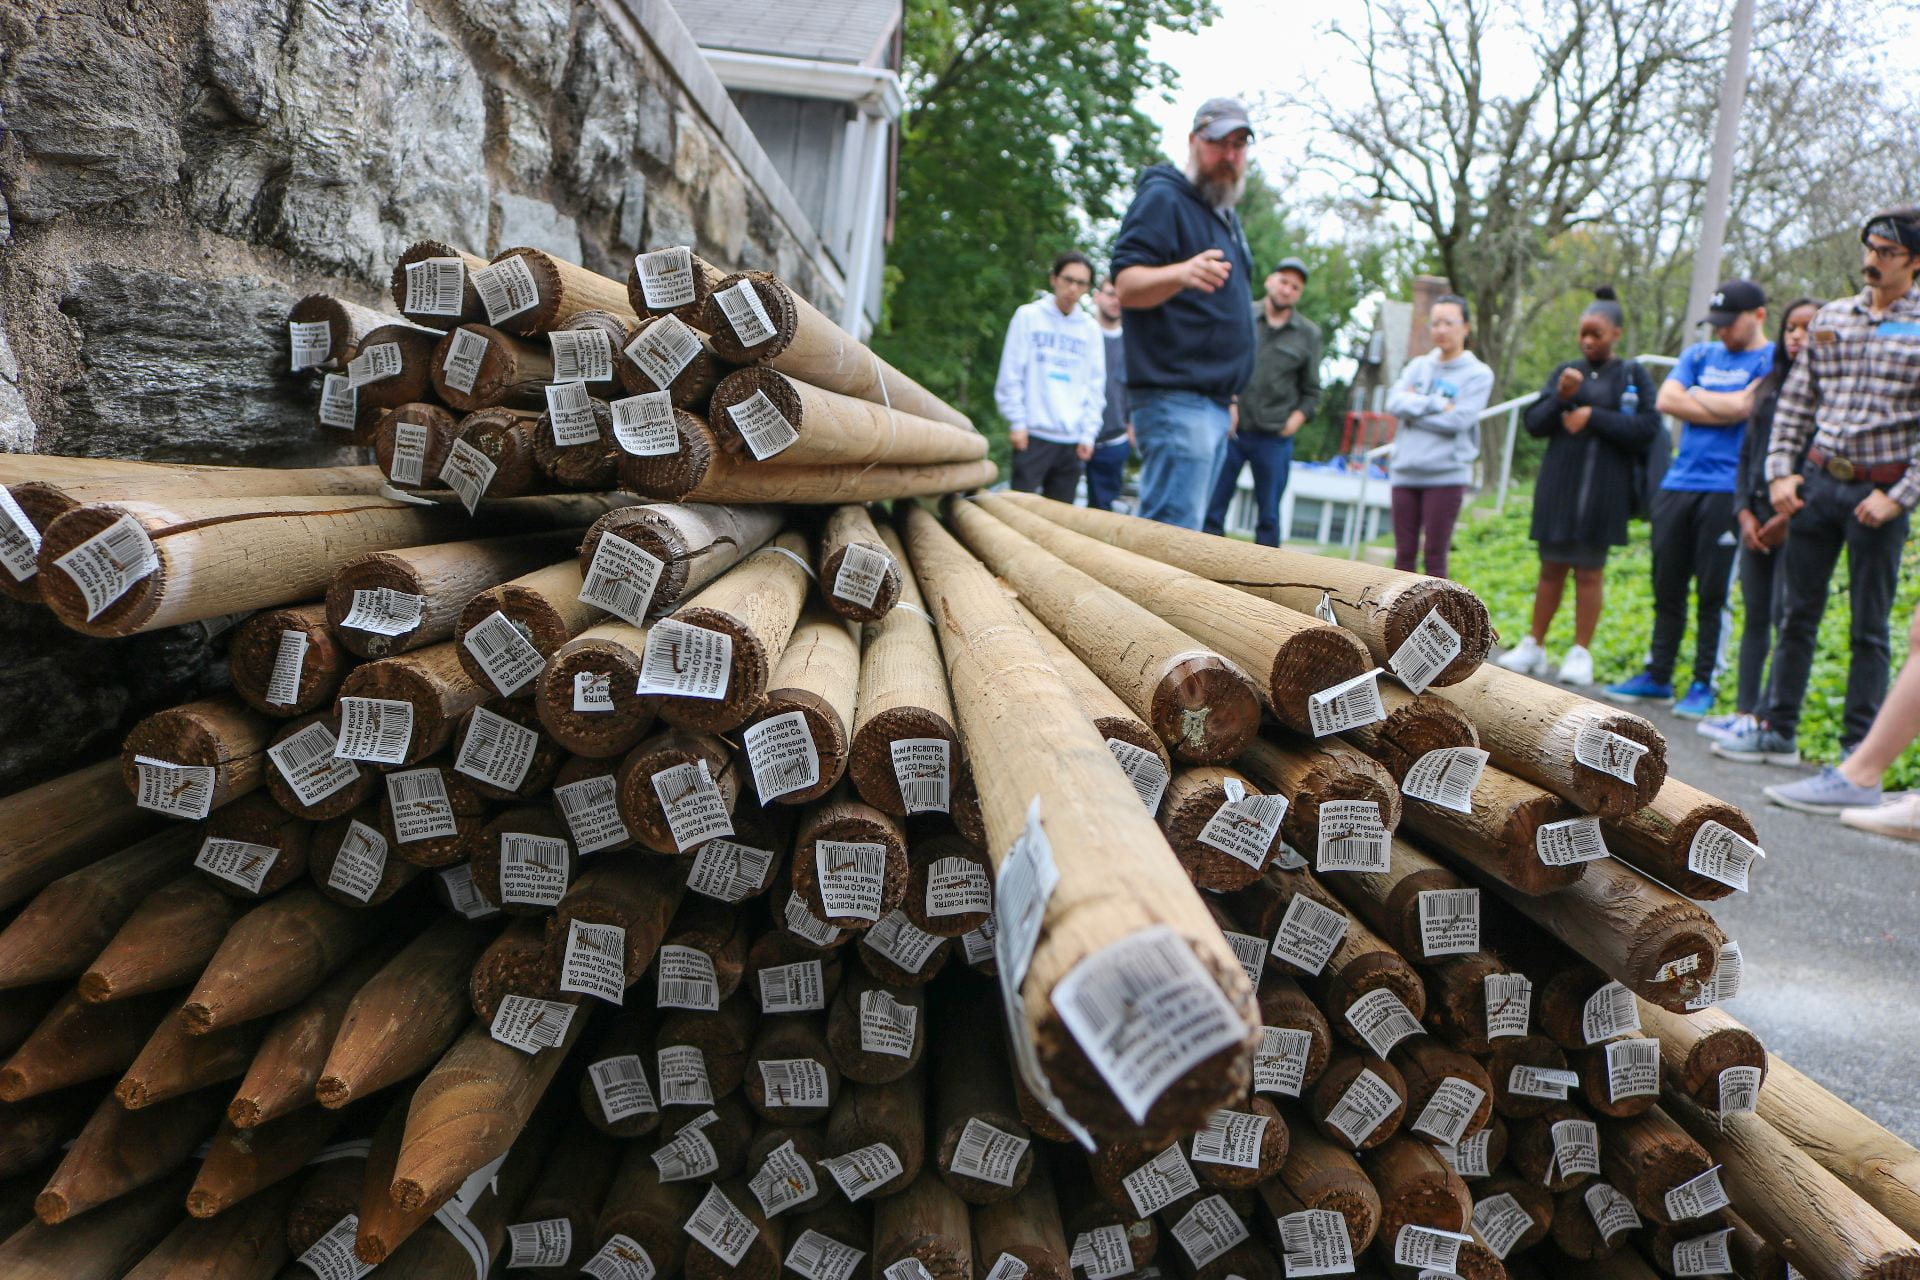
The building process began with prepping the branches. Dozens of wooden poles were sanded and painted with white enamel paint as a base. The lengths of the poles were determined by matching the proportions of the graphs, and they were cut down by the students that provided their respective graphs. After the poles were cut and painted, then the trunks were prepped. Holes with 2-inch diameters were drilled through the sanded trunks in order to hold the 2-inch poles. The trunks were then painted with the same white enamel as the poles, acting as a base for the color enamel. The colors reflect the numbers of the graphs, going from yellow to red as the numbers increase. The poles were also painted to correspond with the number they reflect, as well as being marked with an acrylic label given the specific number. Finally, each trunk was labeled to show what data they express. The tree trunks come together to show a small forest of fallen trees expressing the growing issues with our environment in regards to climate change.

The installation was unveiled on Wednesday November 20, 2019, and is currently displayed in front of the Woodland Building at Penn State Abington.